Carried out with an infant wear manufacturer in Kerala, following a site visit and process walkthrough, this study covers a full-sleeve, front-open romper for infants aged 0–6 months, made from 100% organic cotton knitted as a 190 GSM interlock fabric from double-combed yarn. It follows the garment from organic cotton cultivation through spinning, knitting and dyeing in Tiruppur, garment manufacture in Kerala, and outbound distribution to franchise stores across Kerala, Tamil Nadu and Karnataka. Prepared to ISO 14040 and ISO 14044.
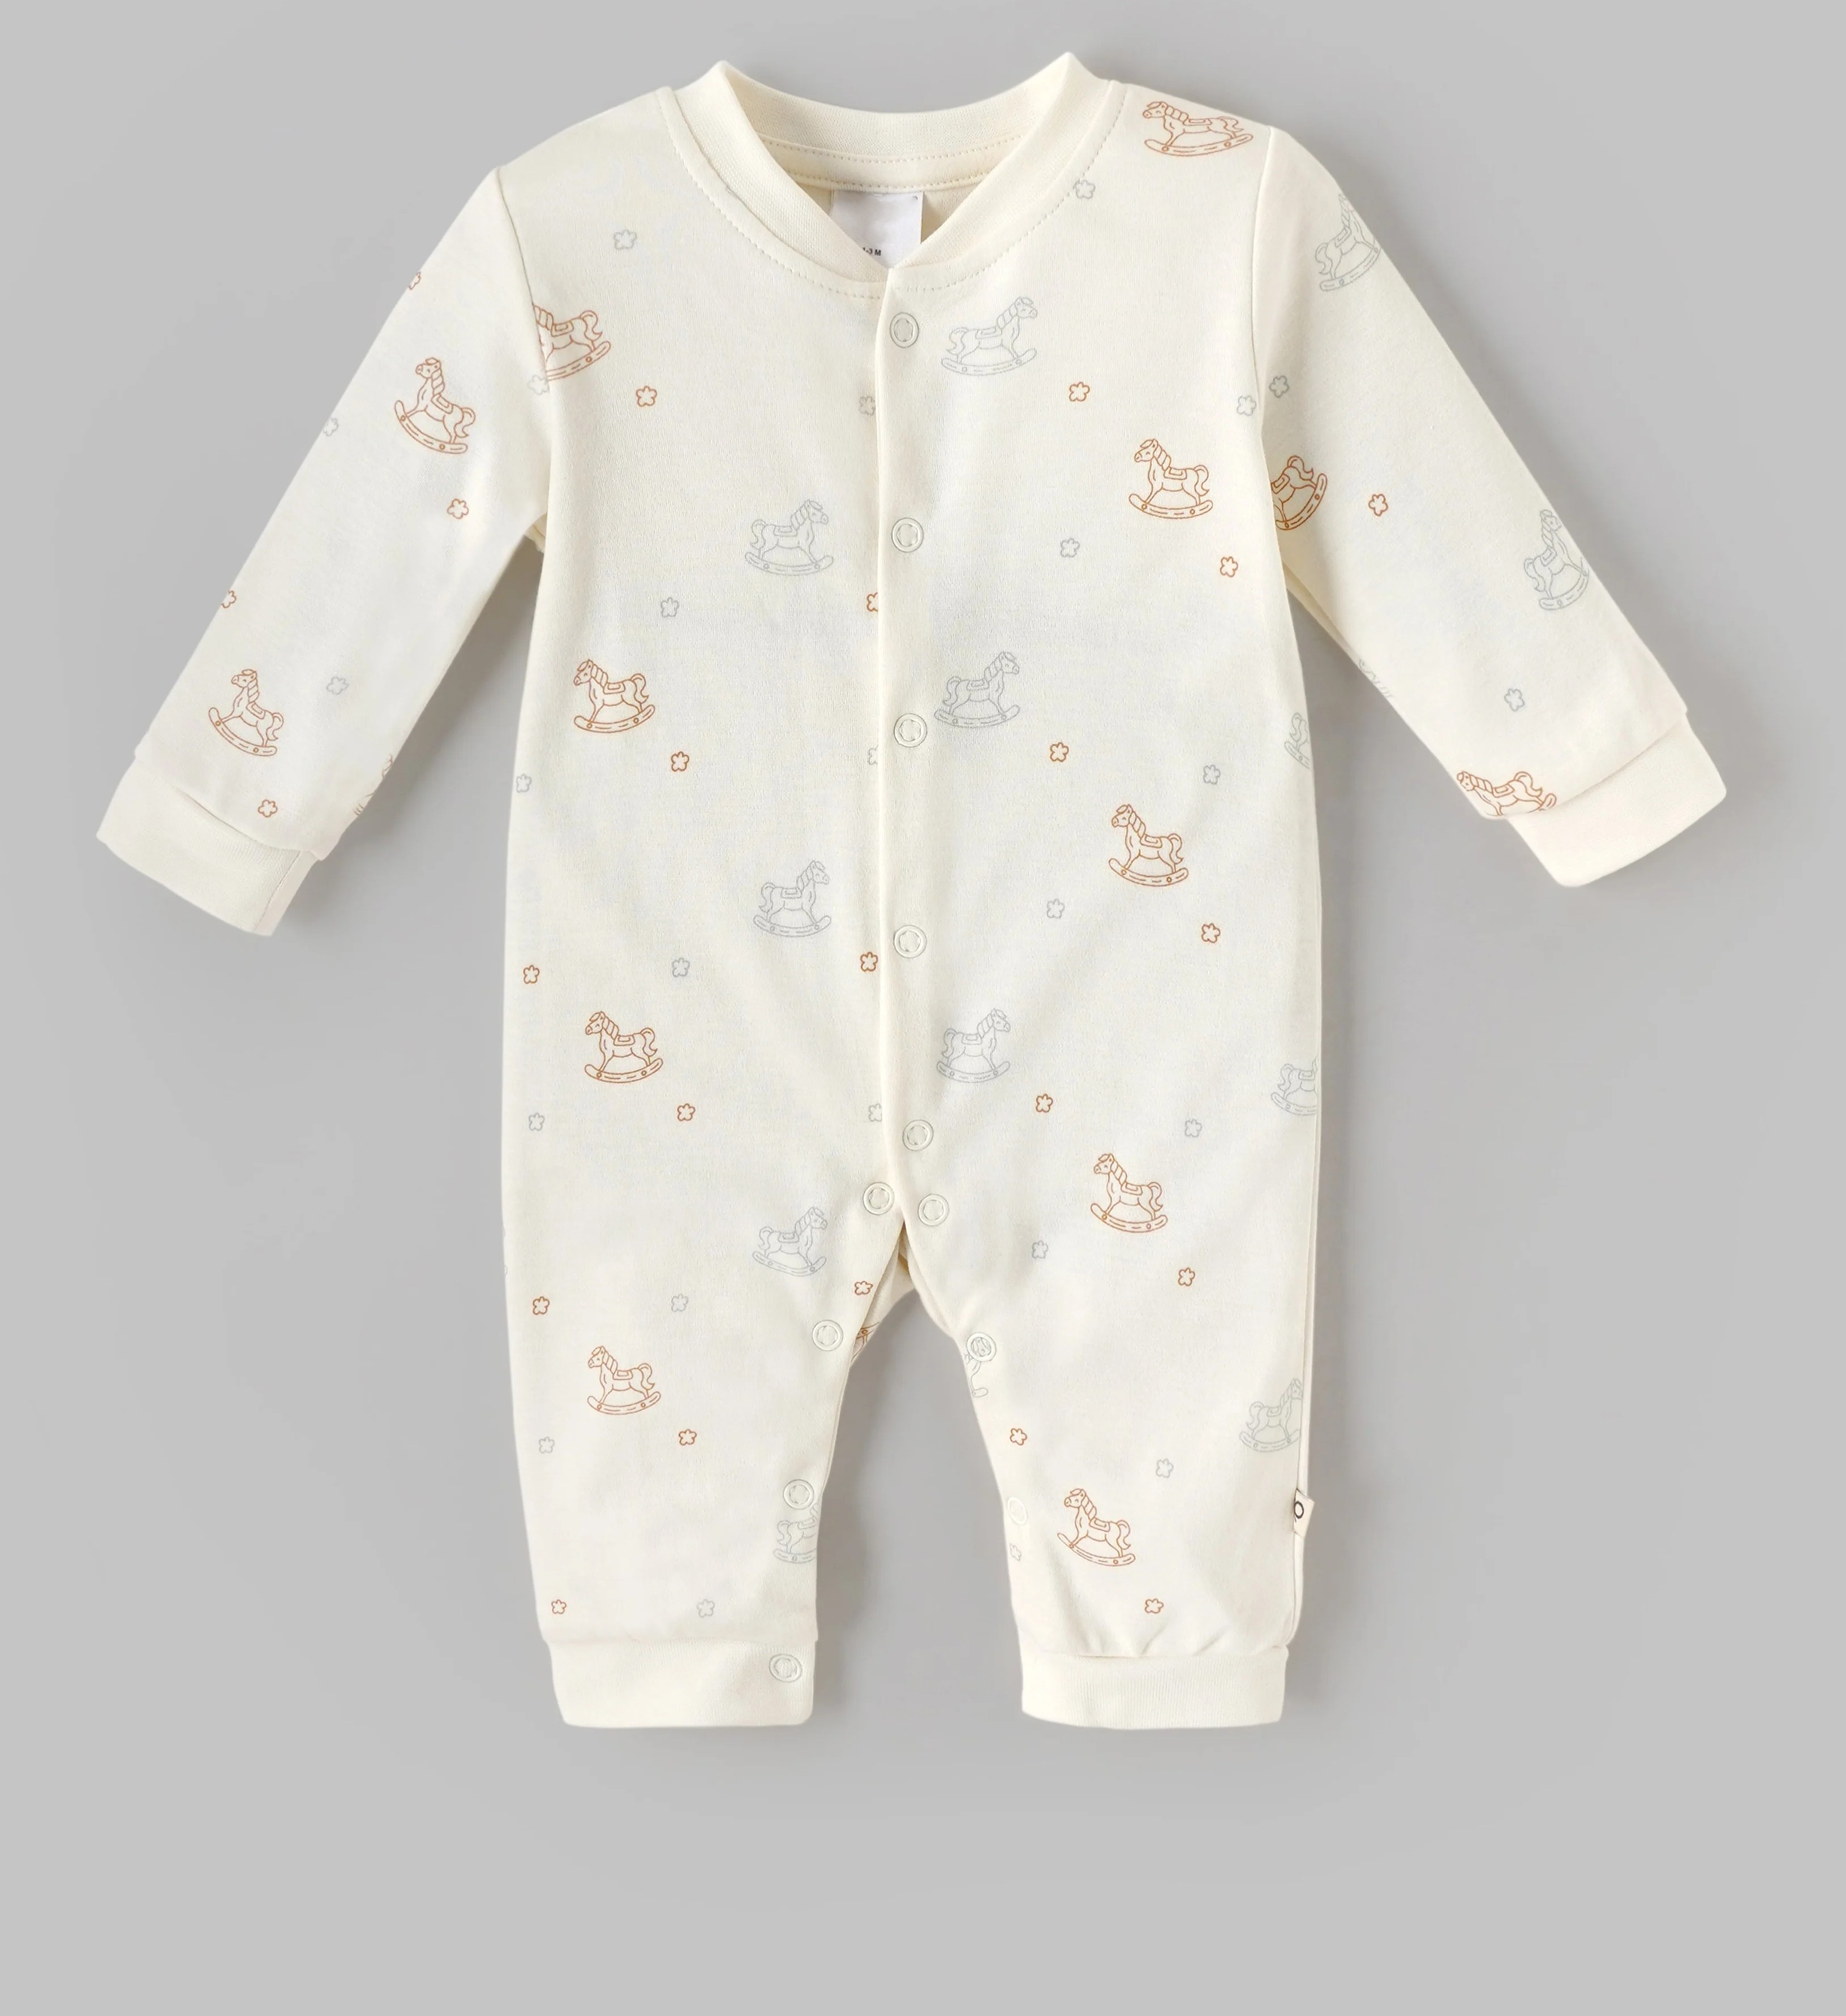
The assessed product — full-sleeve, front-open romper, 0–6 months, 190 GSM organic cotton interlock
Seven stages, from raw cotton to a franchise store shelf. The first five are quantified in this study; the last two are discussed qualitatively.
Cotton farm
India — organic cotton cultivation, no synthetic pesticide
Ginning & spinning
Fibre separated from seed, spun into double-combed yarn
Knitting & dyeing
Tiruppur, Tamil Nadu — 190 GSM interlock knit, wet processing
Inbound transport
400 km, diesel truck, Tiruppur to Kerala
Romper manufacture
Kerala — cut, trim, stitch, X-ray scan, pack
Distribution
Kerala 200 km · Tamil Nadu 350 km · Karnataka 400 km
Use & end of life
Wear, hand-me-down, wash, recycle — discussed qualitatively only
The study quantifies the cradle-to-gate footprint of the garment — carbon, water, and a full suite of ReCiPe 2016 midpoint indicators — identifies the stages that contribute most, and gives the client a defensible narrative covering the garment's full journey, including the stages that sit outside the quantified boundary.
The functional unit is one romper of 110 g finished, packed weight, delivered to a franchise store — a cradle-to-gate scope covering everything from organic cotton cultivation up to the point of retail delivery. Unlike the earlier version of this study, the 110 g figure is the client-specified weight of the actual 0–6 month garment rather than an estimate. This revision supersedes an earlier assessment of a 250 g double-padded, conventional-cotton garment for the 0–1 year range. Product specification, fabric weight and construction, age range and functional unit have all changed at the client's request, so results are not comparable with the earlier version on a like-for-like basis. All foreground inputs originally supplied per kilogram of output were scaled by 0.11 to express results per functional unit.
Upstream stages — organic cotton cultivation, ginning, spinning, knitting and dyeing — are not separately itemised in the primary inventory. They are represented through the embodied footprint of the incoming interlock knit, dyed fabric, characterised using secondary literature adjusted for organic cultivation practice using Textile Exchange and PE International's peer-reviewed organic cotton benchmarks.
The foreground inventory covers the Kerala cut-and-sew stage — cutting, trimming and stitching of the knitted organic cotton fabric, X-ray scanning for contaminants, labelling, tagging and packing — plus inbound and outbound transport, scaled to the 110 g functional unit.
| Flow | Type | Amount | Note |
|---|---|---|---|
| Interlock knit, dyed 100% organic cotton fabric (190 GSM, double-combed) | Input | 0.1265 kg | Includes 0.0165 kg cutting waste |
| Inbound truck transport (16–32 t) | Input | 0.051 t-km | Corrected — 400 km, Tiruppur to Kerala |
| Electricity (Kerala grid) | Input | 0.132 kWh | Cutting, stitching, X-ray scanning, lighting |
| Thread, label, price tag, fastener, inks | Input | 0.0025 kg | Cotton thread and woven label, paper tag, plastic fastener |
| Plastic polybag (LDPE/PP) | Input | 0.0011 kg | Primary packaging per unit |
| Outbound transport to franchise store | Input | 0.0348 t-km | Average across the three destination states |
| Finished romper (0–6 months) | Output | 0.11 kg | Functional unit |
| Fabric waste (cutting loss) | Output | 0.0165 kg | Cutting scraps |
| Trim and packaging waste | Output | 0.00022 kg | Label, trim and polybag rejects |
The supplied inventory listed truck transport as 460 t-km, noted as "transport of 1.15 kg fabric over 400 km." That multiplication gives 460 kg·km — that is, 0.46 tonne-km, not 460. Scaled to the 110 g functional unit, the corrected figure is 0.051 t-km, and every hotspot figure in this study uses the corrected value.
Had 460 t-km been used, transport would have implausibly dominated the footprint of a 110 g product — a useful sanity check for future data collection. Unit mismatches like this are common where mixed teams enter freight data in different conventions, which is why our intake template requires distance and consignment weight as separate fields so that tonne-km is always calculated, never typed.
Distribution distance varies by destination state. Without a sales-volume split, the headline result uses the simple average of the three distances, applied to a rigid diesel truck of the 3.5–7.5 t class typical of last-mile retail distribution.
| Destination | Average distance | t-km per FU | Indicative kg CO₂e |
|---|---|---|---|
| Kerala (local franchise) | 200 km | 0.022 | 0.007 |
| Tamil Nadu | 350 km | 0.039 | 0.012 |
| Karnataka | 400 km | 0.044 | 0.014 |
| Average (used in headline results) | ≈ 317 km | 0.035 | 0.011 |
Once the actual sales split across the three states is available, the weighted-average distance should replace the simple average used here.
Fabric production — organic cotton cultivation, spinning, knitting and dyeing — contributes 89.4% of the carbon footprint and 99.94% of the water footprint. Organic cultivation lowers the size of that bar but does not move it out of first place.
An indicative screening estimate, cradle-to-gate plus outbound distribution, at 1.13 kg CO₂e per romper. Emission factors, organic adjustment method, data sources and allocation choices are set out in the full LCA report.
The water footprint per romper — roughly 7 to 8 litres for every gram of finished garment. 99.94% of it is embedded in organic cultivation and wet processing, before the fabric ever reaches the garment unit. Organic cultivation cuts an estimated 20% from the conventional-cotton figure, but the concentration is unchanged.
The quantified inventory treats the incoming interlock knit, dyed organic cotton fabric as a single input, characterised at roughly 8 kg CO₂e per kilogram of finished fabric — the conventional-cotton literature midpoint of 11 kg reduced by 30% to reflect organic cultivation. Because that one input carries 89.4% of the romper's footprint, it is worth opening up. The decomposition below is indicative, drawn from the apparel LCA literature rather than supplier-specific measurement, and is included to show where within the fabric supply chain the burden actually sits.
Cultivation is the single largest contributor within the fabric input, and it dominates a different set of indicators than the rest of the chain. Organic practice changes the picture materially here: without synthetic pesticide, terrestrial ecotoxicity falls by an estimated 70% to 0.119 kg 1,4-DCB per romper, and human non-carcinogenic toxicity by around 60%. Absence of synthetic fertiliser cuts the freshwater and marine eutrophication results by roughly a quarter, and blue-water demand by around 35%, giving a water consumption figure of 0.37 m³.
One category moves the other way. Land use rises by an estimated 25% to 0.99 m²a crop equivalent, because organic cotton yields are typically lower per hectare, so more land is occupied per kilogram of fibre. That is a genuine trade-off documented in the Textile Exchange benchmark itself, not an artefact of our method, and it belongs in any honest account of the organic switch.
Separating fibre from seed and spinning it into double-combed yarn is comparatively modest in carbon terms but not negligible: spinning is an electricity-intensive mechanical process, and on an India grid at roughly 0.73 kg CO₂e per kWh, that electricity carries weight. Combing adds a further consideration — double-combed yarn removes a higher proportion of short fibres than carded yarn, which may mean additional upstream fibre input beyond what the current fabric-to-output ratio captures. Supplier-specific energy intensity in kWh per kilogram of yarn, and a confirmed combing yield factor, would replace the literature midpoint used here.
Wet processing is where the fabric stage becomes decisive, and it is also where the organic claim stops applying. Fibre being certified organic says nothing about the knitting and dyeing that follow: dye-bath chemistry drives the freshwater ecotoxicity, marine ecotoxicity and human carcinogenic toxicity indicators, and those categories are adjusted far more cautiously in our results — around 20% rather than the 70% applied to cultivation — precisely because GOTS chain-of-custody certification for the Tiruppur processor is unconfirmed. Tiruppur is a designated Zero Liquid Discharge cluster, but plant-level confirmation matters: whether this specific supplier operates a functioning ZLD effluent treatment plant changes what can honestly be claimed about grey water and toxicity.
Moving 0.1265 kg of fabric 400 km from Tiruppur to Kerala contributes 0.051 tonne-km and 0.006 kg CO₂e — 0.5% of the total. This is the stage most often over-weighted by intuition, and the one where the original inventory contained a thousand-fold unit error. Once corrected, freight is a rounding error against fabric production. That is a useful finding in its own right: sourcing fabric from a closer supplier would barely move this footprint, whereas sourcing lower-impact fabric from the same distance would move it substantially.
The cut-and-sew stage is labour-based: cutting, trimming and stitching the knitted fabric, X-ray scanning for metal and other contaminants, then labelling, tagging and packing. Its footprint is almost entirely grid electricity — 0.132 kWh per romper, or 0.096 kg CO₂e, which is 8.5% of the total and the second-largest single line in the study. In water terms it is negligible, at 0.04%. This is also the only stage the client fully controls. Efficient lighting, timing production around solar-heavy grid hours, and a renewable power purchase agreement would each cut into that 8.5%. Trims and packaging together add roughly 0.5%.
Outbound distribution adds 0.011 kg CO₂e, or 1.0% — roughly double the inbound leg despite covering a shorter average distance, because last-mile retail distribution uses smaller trucks running more frequent, less-than-full loads. Kerala deliveries at 200 km carry 0.007 kg CO₂e per romper; Karnataka at 400 km carries 0.014 kg. In water terms, transport is immaterial in both directions.
Switching from conventional double-padded cotton to a lighter, single-layer organic interlock knit cut the absolute footprint substantially — from roughly 3.44 to 1.13 kg CO₂e, and from roughly 3,164 to 1,114 litres. Part of that is simply a lighter garment; part is that organic cultivation is genuinely less carbon- and water-intensive per kilogram of fabric. Neither change alters the finding that has held across every version of this study: fabric production, not garment manufacture or transport, is where decarbonisation and water-stewardship effort belongs.
Work spent optimising the Kerala facility improves a modest but genuinely controllable slice of the footprint, and it is worth doing. The largest remaining gains sit further upstream: lower dye-bath water and energy intensity, supplier decarbonisation, and confirmed effluent treatment. Any water-responsible manufacturing claim needs fabric-supply-chain evidence behind it, not facility-level data from the garment unit alone.
All 18 ReCiPe 2016 (Hierarchist) midpoint indicators for the functional unit, with the organic-cultivation adjustment shown per category. Indicative screening results pending full database characterisation.
| Indicator | Unit | Result | Organic adj. | Dominant contributor |
|---|---|---|---|---|
| Global warming | kg CO₂ eq | 1.13 | − 30% | Organic cotton fabric production |
| Water consumption | m³ | 0.37 | − 35% | Organic cultivation (blue water) |
| Land use | m²a crop eq | 0.99 | + 25% | Organic cultivation (lower yield per hectare) |
| Terrestrial ecotoxicity | kg 1,4-DCB | 0.119 | − 70% | Cultivation — no synthetic pesticide |
| Fossil resource scarcity | kg oil eq | 0.31 | − 35% | Organic cultivation, diesel transport |
| Terrestrial acidification | kg SO₂ eq | 0.0026 | − 50% | Organic cultivation, grid electricity |
The use phase and end of life are not modelled quantitatively, but they matter more for a 0–6 month romper than for almost any other garment.
An infant outgrows a 0–6 month romper within weeks to a couple of months. Passing it on divides its footprint across more wears.
Cooler water and gentle handling extend the life of a lightweight interlock knit and cut energy use, which matters more than water volume alone.
No polyester blend means shed microfibres break down readily in water, and carry a lower pesticide-residue burden than conventional cotton.
A single-layer, single-fibre cotton garment is straightforward to mechanically recycle or compost, unlike a blended fabric.
A 0–6 month romper has one of the shortest wear-lives of any garment category: an infant in this size range grows out of it within weeks to a couple of months. That is far shorter than the wear-life assumed in adult-clothing LCAs, where repeated washing and wearing often dominates lifetime impact. For infant wear the opposite tends to be true: because the embodied cradle-to-gate footprint is fixed at the point of manufacture, it is spread over relatively few wears unless the garment is reused.
That makes reuse the single most powerful lever available after the point of sale. A romper handed down to a sibling, a cousin, or resold to another family divides its cradle-to-gate footprint across two, three or more infancy periods rather than one, lowering the per-wear carbon and water footprint proportionally without any change to how the garment was made.
In the Indian domestic market, hand-washing in cold or lukewarm water remains common for infant clothing, and line-drying in sun is typical. Hand-me-down culture within extended families is strong, and rompers in good condition are frequently passed on rather than discarded. End-of-life for worn-out items often runs through informal channels, principally the scrap and rag trade that feeds India's large informal textile-recycling industry, rather than formal municipal collection. In the UK and EU, machine washing at 30–40°C is standard and resale platforms and charity-shop donation are well-established secondary markets. In the US, formal textile take-back infrastructure is less developed, though thrift donation and a growing baby-clothing resale and rental market offset part of that.
None of this is modelled quantitatively, and none of it should be presented as measured result. It is context for responsible storytelling and for scoping a future consumer-use survey if a full cradle-to-grave assessment is wanted.
Hand-washing is often assumed to be automatically greener. For a lightweight, single-layer interlock knit romper washed carefully there is a reasonable case: no electricity is drawn, water temperature is usually lower, and gentler handling extends the fabric's useful life, which directly reduces the per-wear footprint. The comparison is not unconditional, though. An efficient front-loading machine, run full on a cool cycle, remains a reasonable alternative, particularly for households washing several garments together. The fair summary is that hand-washing helps most through gentler handling and lower energy use rather than simply through using less water, and that both methods benefit from cooler temperatures, appropriately sized loads and mild detergents.
Every wash of every textile sheds microscopic fibre fragments. Peer-reviewed laundering studies find that cellulose fabrics like cotton actually shed more microfibres by mass than polyester, so shedding on its own is not the concern. What matters is what happens next, and this is where the 100% cotton specification counts: cotton microfibres biodegrade readily in aquatic and wastewater-treatment environments — published figures report roughly 89% biodegradation in wastewater within 40 days — whereas polyester microfibres are essentially persistent, at around 5% under the same conditions. The organic designation itself does not change this picture; it is the absence of synthetic fibre, not the cultivation method, that matters for microfibre persistence.
Two caveats remain. If synthetic thread, label or elastic were substituted into the supply chain in a future sourcing change, that would reintroduce a persistent-microfibre pathway and should be flagged for review. And dyes and finishing chemicals carried on shed cotton fibres remain a secondary, less-studied concern even for a biodegradable base fibre. On balance the 100% organic cotton specification is the more favourable choice on microfibre persistence, and that is a defensible claim — provided the supply chain is confirmed free of synthetic trims.
Stated plainly, because a screening study that hides its own uncertainty is worse than no study.
In priority order, weighted by how much each step would reduce the uncertainty that actually matters.
We build screening and full life cycle assessments for products of any size, scoped to what the decision actually needs.
Book a consultation